Social media is buzzing with "crash" calls.
Everyone is spinning a narrative to explain why the Nasdaq is dropping like a rock.
The last two weeks have been historic for the index, in fact. But not in a good way.
On Thursday, the index printed one of its worst days ever:
Those are the days that will shake even the most veteran investor.
That day was the worst for the $QQQ since the middle of the COVID panic.
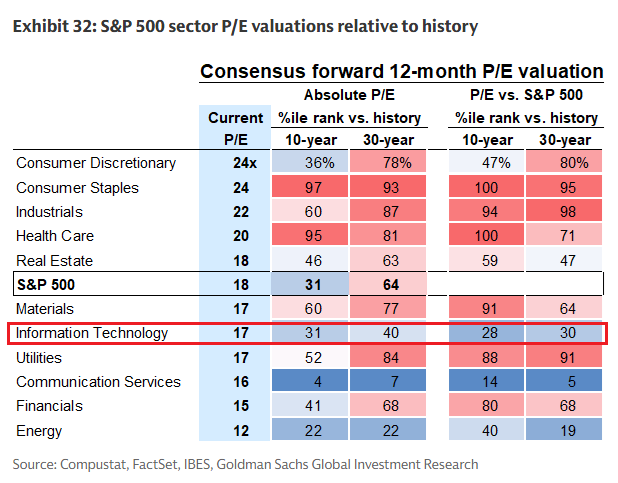
Now, tech stocks are trading at cheap valuations:
Compared to the S&P 500 index, technology is quite cheap:
But, as the respected Chuck Carnevale has said:
"It’s a market of stocks, not a stock market."
There are valuable lessons to learn from today's market, which helps to explain why tech is dropping and how sentiment and momentum can move against fundamentals. I'm going to explain these lessons today, and share an impressive update about the Boomer Bucket List Portfolio.
Why Tech is in the duldrums
The internet is rife with theories and explanations as to why the tech sector, represented by $QQQ, is performing so poorly.
These theories include the end of the a.i. bubble, imminent margin compression, rotten balance sheets and credit that is due to implode, and more.
My social media feeds are full of words like "crash" and "bubble."
The truth is, every market needs healthy consolidations now and then. The market always looks for an excuse or reason for the market to do this. But quite simply, most corrections are natural. Here's why.
Technology has been performing superbly well.
Technology continues to expect excellent results going forward.
An outlook that bright attracts many buyers.
When the buyers run out, price must fall.
Examine this chart of the Nasdaq futures market with the Commitment of Traders report below it:
The candle chart is the price of the Nasdaq futures. The red line in the COT chart represents the position of speculators in the market. The green line represents the position of commercials in the market. Commercials have a consistent record of being "right" about moves in the market.
The commercials position effectively is an opposite of the speculators because the commercials make the market and buy or sell positions to the speculators.
It is much more technical than that brief explanation. What you need to know is this: the speculators are often wrong when they pile into the same position.
It's like crowding one side of the boat. Eventually, an equal and opposite reaction is needed to flush out the crowded positioning.
You can see how this played out earlier in 2026 when speculator positioning became excessively long. Positioning balanced out through a washout that saw price trade lower.
Today, speculator positioning is even more extreme than it was during the previous washout.
Price will continue to weaken under the gravity-like effects of flushing out the market and reaching a new state of equilibrium.
This does not mean that a.i. is dead.
Or that semis are dead.
Or that a crash has begun.
It's a rotation, not a crash
Clearly, the data shows that this move in the markets is volatile but its a rotation fueled by a flush out in tech.
Take a look at the same Commitment of Traders report but for the S&P 500 which still has Technology stocks but less than the Nasdaq:
The commercials are net long! Speculators are midly short the S&P 500.
These conditions are nearly the opposite of the Nasdaq.
This explains why the S&P 500 is suffering less than the Nasdaq: down 6% in 9 days vs 7.5%.
The S&p 500 and the Nasdaq still share many of the same stocks and this explains the weakness in the S&P 500 despite more favorable positioning.
So let's look at something that does not share the same technology exposure: the $SCHD.
$SCHD is a dividend focused ETF managed by Charles Schwab. Here's how the ETF has been performing against the $QQQ lately:
$SCHD is the candles while the $QQQ is the blue line. They are nearly complete opposites over the past few months with $SCHD up 7.8% while the $QQQ is down 9%.
The most significant similarity between the two price charts is in the last two days where $SCHD dropped heavily on the same day the Nasdaq dropped 6.5%. This is because of liquidity stress which causes many traders to sell positions to raise capital and cover margin requirements.
Defensive sectors besides dividends have been outperforming technology over this time period, including healthcare and financials.
Traders are clearly pivoting their capital out of a falling tech sector and into anything that is not falling.
That is a behavioral decision, not a fundamental one.
So what are the fundamentals?
Right now, I believe that stocks are the most disconnected from fundamentals since 2022.
The data from FASTGraphs, the software tool created by Chuck Carnevale, reveals the truth.
Here is the FASTGraphs chart of the $QQQ:
The $QQQ is now trading at 25x earnings. This is below the mean of 30.45x.
Based on earnings estimates, if the $QQQ continues to trade at its current valuation into 2028 the tool projects a total return of 101%. (This is a projection based on assumptions, not a forecast)
In comparison, under the same conditions the $SPY (S&P 500) is projected to return 65%:
And the $SCHD ETF is expected to return 28.5%:
However, $SCHD is trading significantly above its average valuation while $SPY trades in line with its and the $QQQ trades below its average.
Therefore, I have no interest in $SCHD and see serious risks over the coming year or two.
Revisiting Chuck's famous quote "It's a market of stocks not a stock market" I have noticed some very concerning valuations of individual stocks. Here's Walmart $WMT for example:
Trading at a nosebleed valuation of 44x earnings.
Earnings growth is estimated to be 11% going forward.
Traditional valuation methodology suggests that the fair value of $WMT is around 15x earnings. Walmart could fall 40% in price and still only be considered fairly valued.
These are the conditions that scare me. I avoid them entirely. And this is all thanks to my favorite tool, FASTGraphs.
Why is Walmart trading so expensively?
Perhaps there is more to the Walmart story that meets my eye.
I kinda doubt it.
I think the market is piling into the mega retailer because it's perceived as safe and defensive in the current environment. Walmart doesn't have much exposure to tech or a.i.
In comparison, there is the chart for Amazon $AMZN, a mega online retailer with significant exposure to tech and a.i.:
$AMZN trades at 21.6x earnings with earnings expected to grow by 9% annually.
Would I rather own $WMT at 44x earnings and 11% earnings growth or $AMZN at 21x earnings and 9% growth?
My portfolio has $AMZN.
The Boomer Bucket List has been Booming
In previous editions I introduced the Boomer Bucket List portfolio. This is a portfolio of stocks that I created to take advantage of spending by the Boomer Generation in the decades ahead.
This portfolio included many healthcare and defensive names, so it benefited from these market rotations we have discussed.
Over the past month, the Boomer Bucket List fund has gained 10.3%.
This outperforms $SCHD at 7.4% and $QQQ at -13.8% during the same time period.
I have not made any moves or changes to the Boomer Bucket List (BBL) portfolio. Below are the current list of holdings:
None of these names or portfolios are recommendations. I'm not a licensed financial professional. This information is for educational purposes only.